I am a
Data Analyst
VANSH PATEL
A motivated and detail-oriented Data Analyst with a strong foundation in data analysis, statistical modeling, and data visualization. Skilled in using tools such as SQL, Excel, Python (Pandas, Matplotlib, Seaborn), and data visualization platforms like Tableau and Power BI. Equipped with a solid understanding of data cleaning, transformation, and analysis to derive actionable insights. Eager to apply academic knowledge and hands-on project experience to solve real-world problems and contribute to data-driven decision-making in a dynamic professional environment.


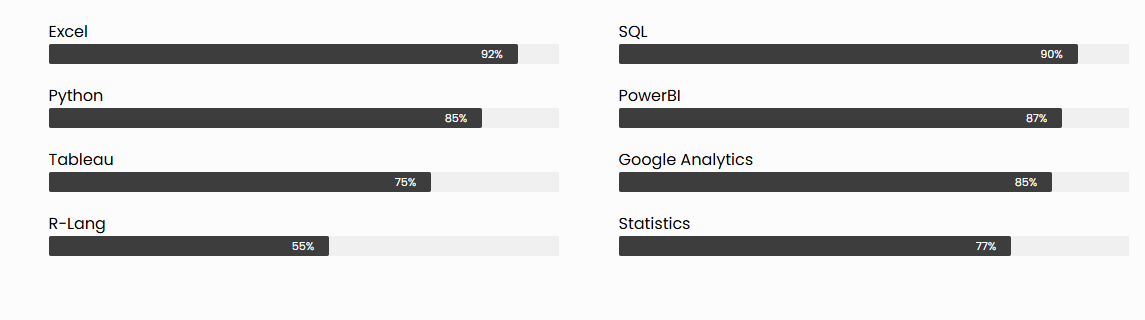
MY SKILLS
Proficient in data analysis, Excel, SQL, Power BI, data visualization, and translating complex datasets into actionable business insights.
Education
Certifications & Licenses
Year - 2020
Gujarat Technological University - India
Bachelors Of Engineering In Information Technology
St. Clair College - Canada
Post Graduation Diploma In Data Analytics
GPA - 3.5 (Academic Honors)
Year - 2022


Google Professional Data Analytics
IBM Professional Data Analytics
Microsoft Professional Data Analytics
Year - 2022
Year - 2023
Year - 2025
Meta Data Analyst Certificate
Year - 2025


CGPA - 7.5 (First Class With Distinction)
TAKE A LOOK INTO MY PROJECTS
As a data enthusiast with experience in Python, Excel, Tableau, Power BI, SQL, and R, I have successfully completed a variety of projects that demonstrate my ability to analyze, visualize, and interpret complex datasets to deliver actionable insights.
07
06
Tools
Projects
The projects I have undertaken involve data collection, cleaning, transformation, and visualization, as well as applying advanced statistical and machine learning techniques. By leveraging my skills in SQL for data extraction, Excel for data manipulation, and Python and R for analysis and modeling, I have been able to deliver solutions that support better decision-making and drive performance improvements across various industries.
In addition to performing complex data analysis, I have used Tableau and Power BI to create interactive dashboards and reports that provide stakeholders with intuitive, real-time access to key metrics and insights. These dashboards empower organizations to monitor performance, identify trends, and take data-driven actions with ease.