MY PROJECTS
In this project, I leveraged SQL and Power BI to analyze and visualize sales data to derive actionable insights. Using SQL, I queried and managed large datasets, performing data extraction, cleaning, and transformation to ensure accuracy and relevance. Once the data was prepared, I utilized Power BI to create interactive dashboards and visual reports that highlight key sales trends, customer behavior, and performance metrics. This project aimed to provide clear, data-driven insights that support better decision-making and strategic planning for sales teams, helping businesses optimize their sales processes and drive growth.
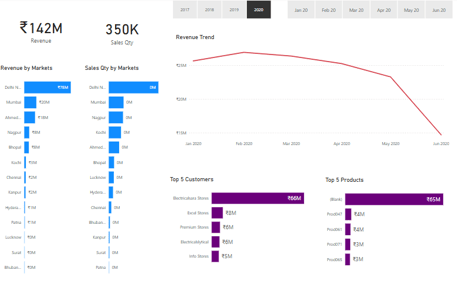
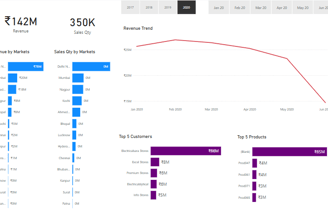
SALES INSIGHTS
This project involves the comprehensive analysis of the T20 Cricket World Cup 2022 data, utilizing a range of tools and technologies to provide actionable insights into the tournament. The process begins with data collection and preprocessing using Python and Pandas, where I cleaned, structured, and transformed raw data into usable formats. This involved dealing with missing values, filtering data, and creating new variables to enrich the analysis.
T20 CRICKET DATA ANALYTICS PROJECT
Next, I utilized Excel to perform initial analysis and basic visualizations, helping to identify key performance indicators and trends. The final phase of the project involved creating dynamic and interactive reports in Power BI, where I built insightful dashboards that showcase player statistics, team performance, match results, and tournament trends.
This HR Data Analytics project aims to showcase the power of Excel and Power BI, two essential tools for analyzing and visualizing HR data, to address common HR challenges. Through this project, we will analyze HR datasets to uncover actionable insights that can improve recruitment, employee retention, and performance management. The goal is to demonstrate how data can be used to drive more effective HR strategies and improve overall organizational outcomes.
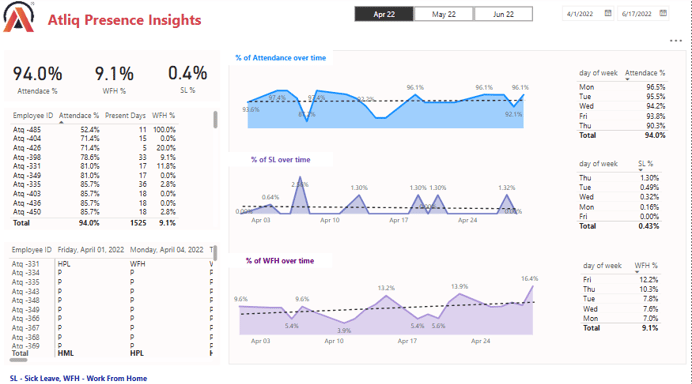
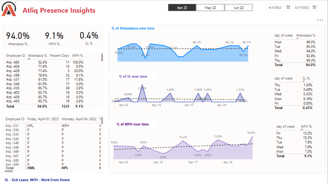
HR ANALYTICS
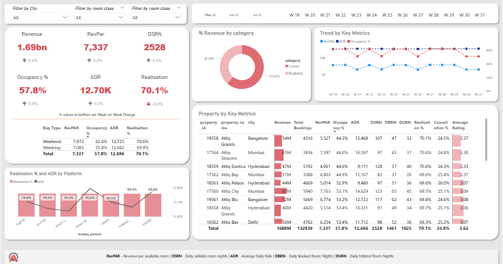
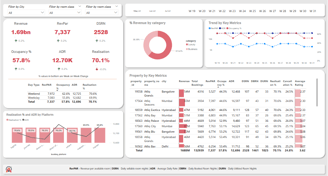
HOSPITALITY DOMAIN PROJECT
This Hospitality Domain Data Analytics Project aims to showcase how tools like Excel, Python, and Power BI can be used to analyze and visualize key metrics in the hospitality industry. The project will focus on using these tools to extract valuable insights from operational and customer-related data, with the ultimate goal of helping hospitality businesses make data-driven decisions.
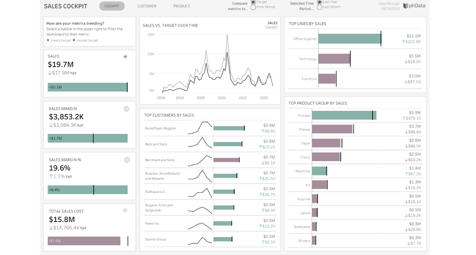
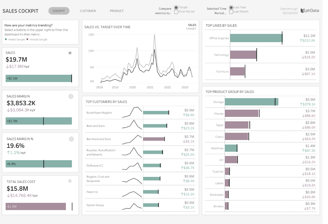
BUSINESS INSIGHTS $ ANALYTICS
In today’s data-driven business environment, organizations across industries are increasingly relying on analytics to make informed decisions, improve performance, and gain a competitive advantage. Business Insights and Analytics involves the use of data to uncover trends, patterns, and actionable insights that can drive business strategy, enhance operational efficiency, and foster growth.
This Business Insights and Analytics Project focuses on harnessing the power of Excel, MySQL, and Tableau to analyze business data and extract key insights that can guide decision-making. By leveraging these tools, businesses can perform data analysis, create interactive visualizations, and generate reports that drive more effective decision-making at all levels of the organization.
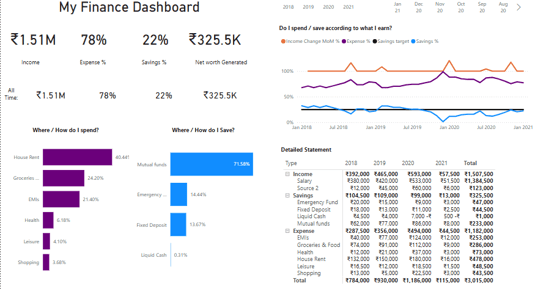
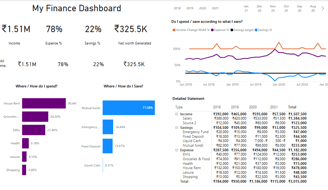
PERSONAL FINANCES
In this project, I created and analyzed a personal finance dataset using Excel and Power BI. The goal was to better understand my financial habits, track income, expenses, savings, and investments, and identify areas for improvement. Using Excel, I organized the data and performed initial calculations, while Power BI was used to create interactive and visually engaging dashboards to gain deeper insights into my financial situation. This project allowed me to enhance my data management and visualization skills, while also providing valuable insights into my personal financial health.
HEART ATTACK POSSIBILITIES
This project focuses on analyzing the likelihood of heart attack occurrences based on various health-related factors using Excel and Python. The dataset includes variables such as age, cholesterol levels, blood pressure, smoking habits, and other key health indicators. Excel was used to clean, organize, and perform initial data exploration, while Python was utilized for more advanced data analysis and machine learning. The goal of this project was to identify patterns and key risk factors contributing to heart attacks, ultimately providing valuable insights for preventative healthcare measures. By applying data analytics techniques, this project aims to better understand the factors that influence heart attack risks and improve overall health decision-making.